
Chart Marking, Harmonic Patterns, and Strategic Progression
Chart Marking, Harmonic Patterns, and
Strategic Progression
Understanding how to read and mark charts is not a surface-level skill. For options traders navigating complex assets like NVIDIA (NVDA) within the Mag 7, it's about mapping the unseen cycles—tracking harmonics, identifying timing zones, and preparing for price progression.
This post dives into the core process of marking charts, reading harmonic patterns, and positioning options strategies—all with a deep focus on actionable progression and premium recycling.
The Foundation: Understanding the Key Chart Zones
Before we dive into patterns, let's establish the primary zones of interest that dictate the strategy.
Red Zone (Resistance/Sell Zone):This is where price faces major resistance—marked between $130 and $150. It's the key profit-taking area where options premiums spike.
Green Zone (Support/Buy Zone):Situated between $100 and $110, this is the strategic buyback region. If NVDA retraces into this range, it's the ideal re-entry point.
Blue Zone (Extreme Risk/Opportunity Zone):Prices dropping between $60 and $80 trigger high-alert. This is the defensive zone for final position evaluation and possible aggressive re-entry.us cupiditate similique quisquam et deserunt, recusandae.

Chart #1: Establishing Strategy Layers
This initial markup establishes the core strategy:
Buy Puts as NVDA approaches the upper resistance (red zone) to hedge against a potential drop.
Sell Covered Calls near the same resistance point, securing premium in anticipation of pullback.
If NVDA is called away (position gets sold), the premium from covered calls is earmarked to buy back the stock as price retraces.
10% of profits from upward movements fund the cost of protective puts—creating a self-sustaining, risk-managed system.

Chart #2: Tracking the Harmonic Pattern Progression
The ABCD harmonic pattern forms here.
Point A to B reflects the initial downward movement.
Point B to C represents the correction—often mistaken as a breakout but is, in reality, a dead cat bounce.
Point C to D anticipates the deeper move lower, aligning with support zones.
This harmonic guides our expectation that NVDA will likely retest support levels. Traders need to remain patient—waiting for the harmonic "D" confirmation before re-engaging.

Chart #3: The Power of Time-Cycle Progressions
Vertical yellow cycle markers identify historical points where price action shifted. Notice the pattern:
December 2024 showed key inflection behavior.
March to April 2025 becomes the next high-probability zone for directional change.
For options traders, these dates are premium moments—times where volatility spikes and contracts become more valuable. Positioning ahead of these dates is a key advantage.
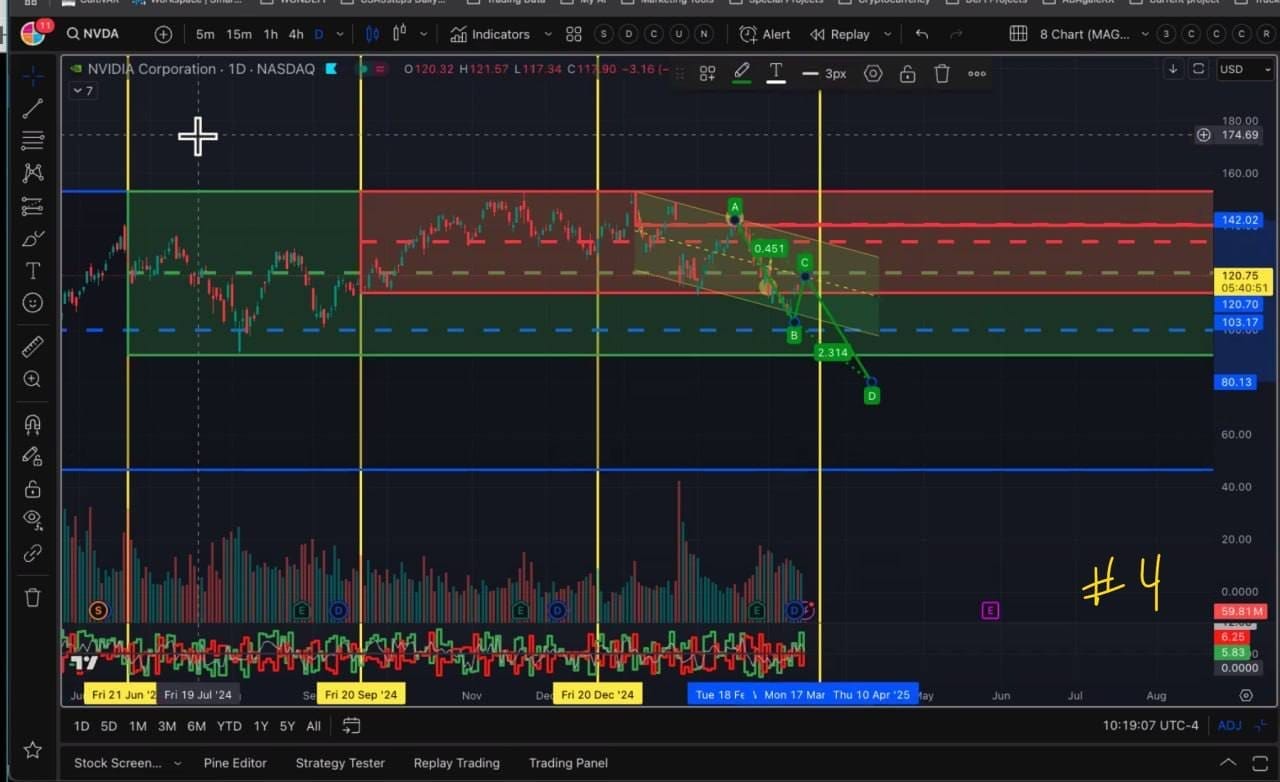
Chart #4: Refining Support Levels
The chart confirms deeper support at $80–$100, signaling where to set re-entry alerts.
The harmonic "D" projection aligns with these lower zones, strengthening the probability of a touch before reversal.
This is the zone where traders should plan to recycle capital—using premiums from earlier call sales to buy back shares for the next cycle.

Chart #5: Progression Lock-In
The harmonic projection intensifies, showing that NVDA’s trajectory is likely to test the extreme support zone.
Traders must focus on timing. If NVDA stalls within the green zone, it becomes a strategic re-entry. If it pushes lower, the blue zone becomes the final defense.
This is where patience and observation override emotion.

Chart #6: Risk Management Protocols
The chart introduces risk management layers—highlighting the lower red line around $61.91.
If NVDA collapses this low, traders should evaluate overall position exposure and consider taking losses to avoid deeper damage.
This isn't fear—it's strategy. Accept the loss, reposition with remaining capital, and wait for the harmonic cycle to stabilize.

Chart #7: Deep Pattern Convergence
The broader pattern converges with a larger ABCD structure.
This larger cycle aligns with the timing markers into April 2025, signaling high potential for significant price action.
Traders should expect larger market movements and prepare for major repositioning. If NVDA hits this convergence zone, it’s the moment to strike—either as a long re-entry or final profit exit.
Chart #8: Full Cycle Awareness
This final chart zooms out—highlighting the full harmonic cycle and historical timing markers.
The long-term support level near $75–$80 becomes critical.
The next major cycle marker is June 20, 2025—a high-alert date for major positioning adjustments.
If NVDA drops and stabilizes, it signals a multi-year reset, providing long-term position potential.
Key Trading Lessons for Mag 7 Options Students
Understand the Zones:Each chart zone has a purpose—either for action or for observation. Respect these levels and avoid reactionary trades.
Master Harmonic Timing:Patterns don’t lie. When harmonic "D" points align with cycle markers, that's where the biggest opportunities exist.
Recycling Premium is Pwer:Every covered call sold generates a future weapon. When NVDA falls, that premium funds your re-entry—keeping risk minimal and positions sovereign.
Risk Management is Sovereignty:If NVDA breaks key zones (like $61.91), there’s no room for hope. Cut the loss, secure capital, and prepare for the next opportunity.
Patience is the Edge:Wait for the timing cycles. When harmonic patterns and price levels align with time markers, the field is optimized for entry.
Final Thought: The Game is Cycles, Not Chaos
Options trading is not chaos—it’s cycles. Harmonics, time markers, and strategic layering aren't just theories. They're the framework of market reality.
The trader who masters cycle discipline, who reads the harmonics without distortion, and who moves when timing aligns—wins.
That’s how you own the cycle. That’s how you stay sovereign in the options field.
This is the framework for NVDA. The rhythm is clear. Now, it’s about executing it with precision.
©2025 Pro Series Profits & CSA5Steps. All Rights Reserved.