
Wick and Sticks: How Candles Talk to Traders
Wick and Sticks: How Candles Talk to Traders
Candlestick charts have been a cornerstone of technical analysis for centuries, first developed by Japanese rice traders to forecast market prices. Their simplicity and depth make them indispensable tools for modern traders across financial markets. But the secret to their power lies in learning how to listen to what the "wicks and sticks" of the candles are telling you. Let’s dive into how candlesticks talk to traders and use real-world examples to illuminate the insights they offer.
Understanding the Anatomy of a Candlestick
To start, a candlestick has two main components:
The Body: This is the rectangular part of the candlestick, showing the open and close prices. A green (or white) body indicates a bullish period where the price closed higher than it opened.
A red (or black) body indicates a bearish period where the price closed lower than it opened.
The Wick (or Shadow): These thin lines extend above and/or below the body and show the highest and lowest prices reached during the session.
When traders learn to interpret these components, candlesticks become a visual language. For example, a long wick indicates price rejection at either the top (resistance) or the bottom (support), depending on its position.
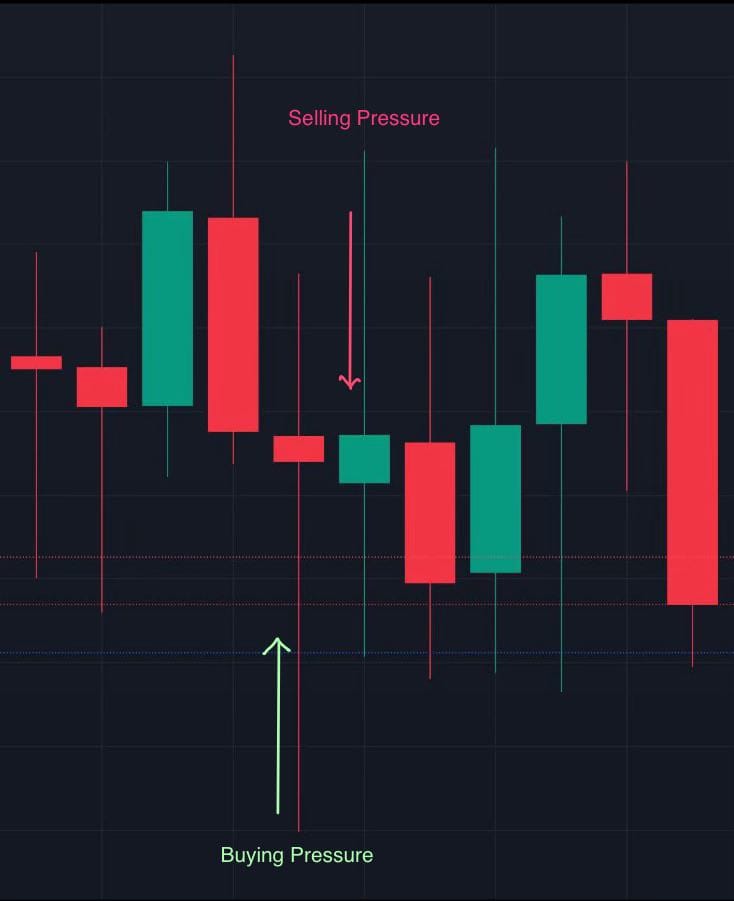
Wicks Tell a Story: Buying and Selling Pressure
Each wick represents market pressure:
Upper Wick: Signals selling pressure. The price moved higher during the session, but sellers forced it back down before the close.
Lower Wick: Signals buying pressure. The price dropped lower, but buyers stepped in to push it back up.
For instance, consider a candlestick with a small body and a long upper wick. This suggests that bulls attempted to push prices higher, but bears regained control. If this happens near a key resistance level, it’s a warning sign of potential reversal or market exhaustion.
Real-World Example 1: The Long-Legged Doji
In the example below, we observed a long-legged doji candlestick. This pattern is characterized by a tiny or non-existent body and long wicks on both ends. The doji highlights indecision in the market. Buyers and sellers battled throughout the session, but neither side won decisively.
When seen at the top of an uptrend, this pattern signals that bulls might be losing momentum, setting the stage for a potential bearish reversal. However, confirmation is key—traders look for the next candlestick to determine whether the market continues higher or reverses.

Real-World Example 2: The Hammer and Inverted Hammer
The hammer is another powerful pattern. It has a small body at the top with a long lower wick, signaling strong buying pressure.
For example:
In a downtrend, the hammer suggests that bears pushed the price lower, but buyers stepped in with strength, potentially reversing the trend upward.
Conversely, the inverted hammer, which has a small body near the bottom and a long upper wick, can indicate weakening bullish attempts and possible bearish continuation if it appears during a downtrend.
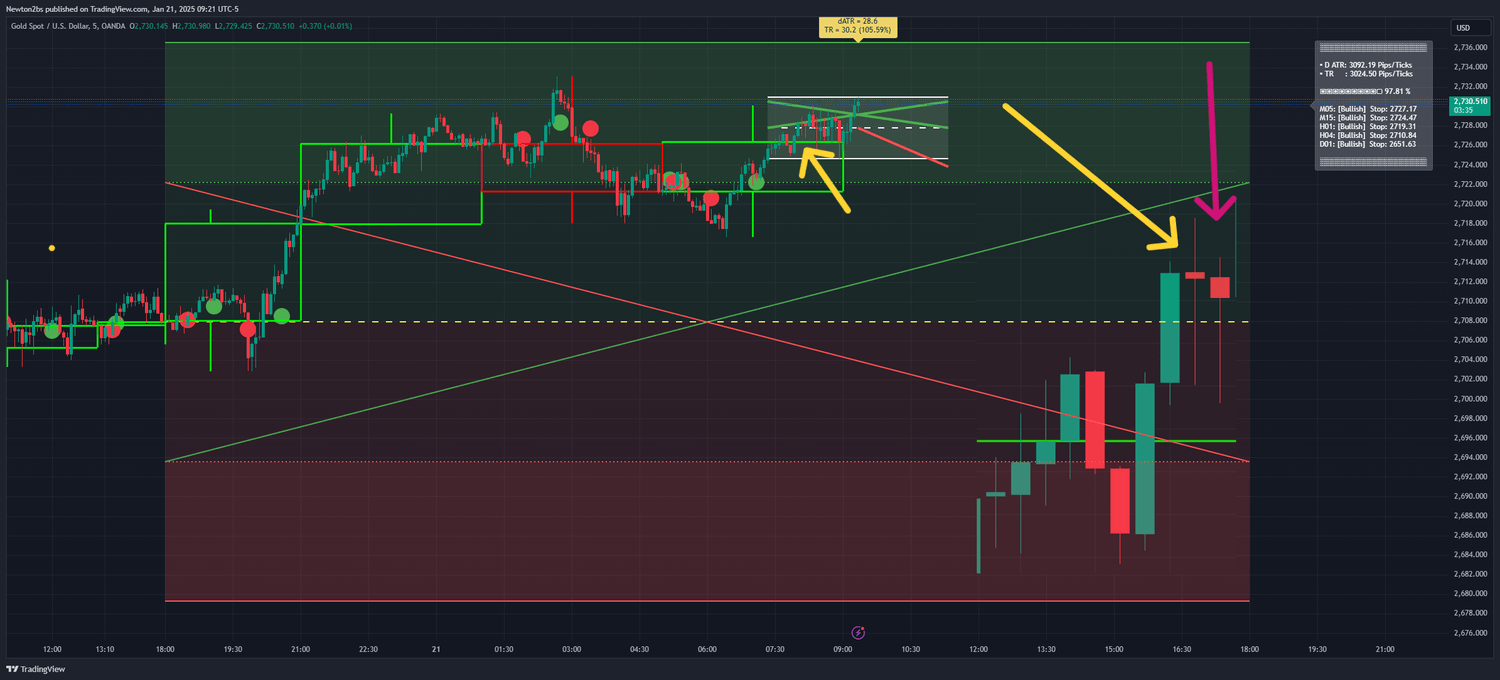
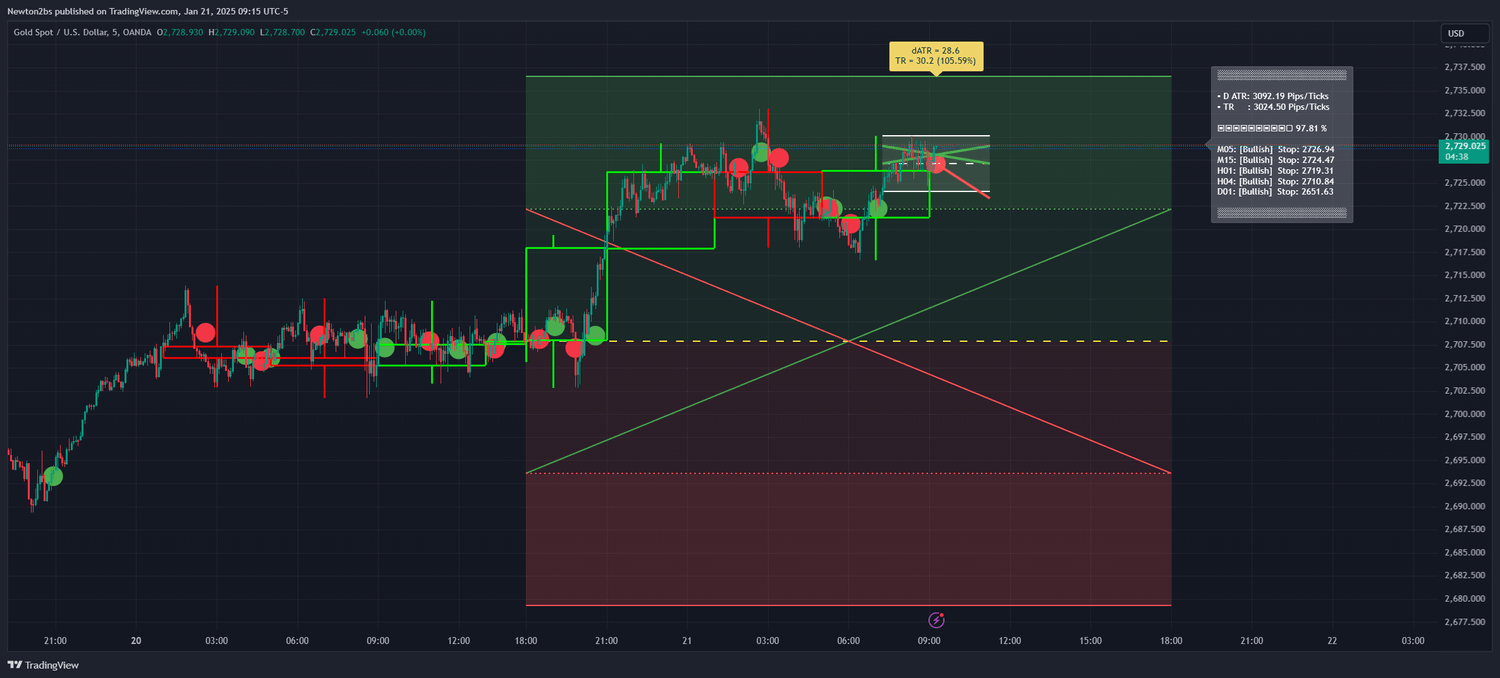
Wicks in Context: Consolidation and Breakouts
Another important observation from this thread is how wicks behave during consolidation and breakouts. When candlesticks show long wicks at both ends, they highlight key support and resistance levels. If a breakout follows such consolidation, it’s a clear signal of where the market intends to move.
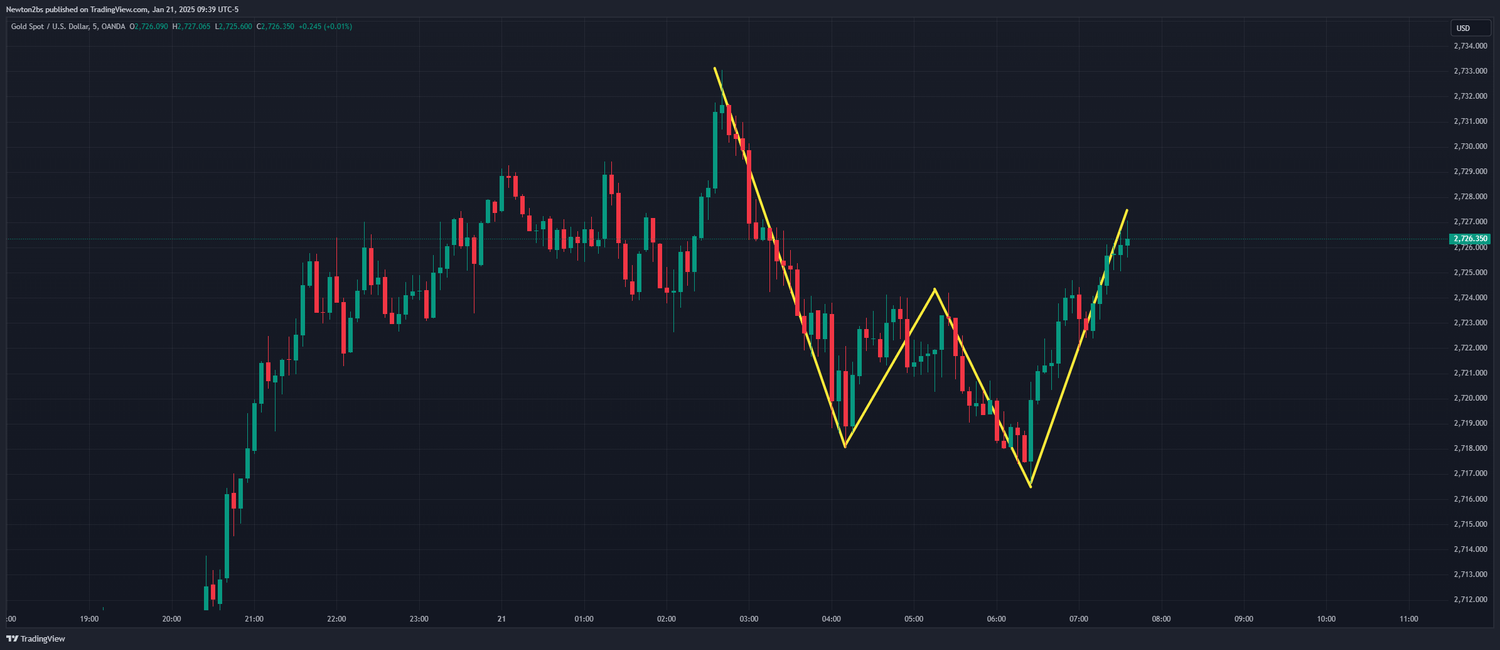
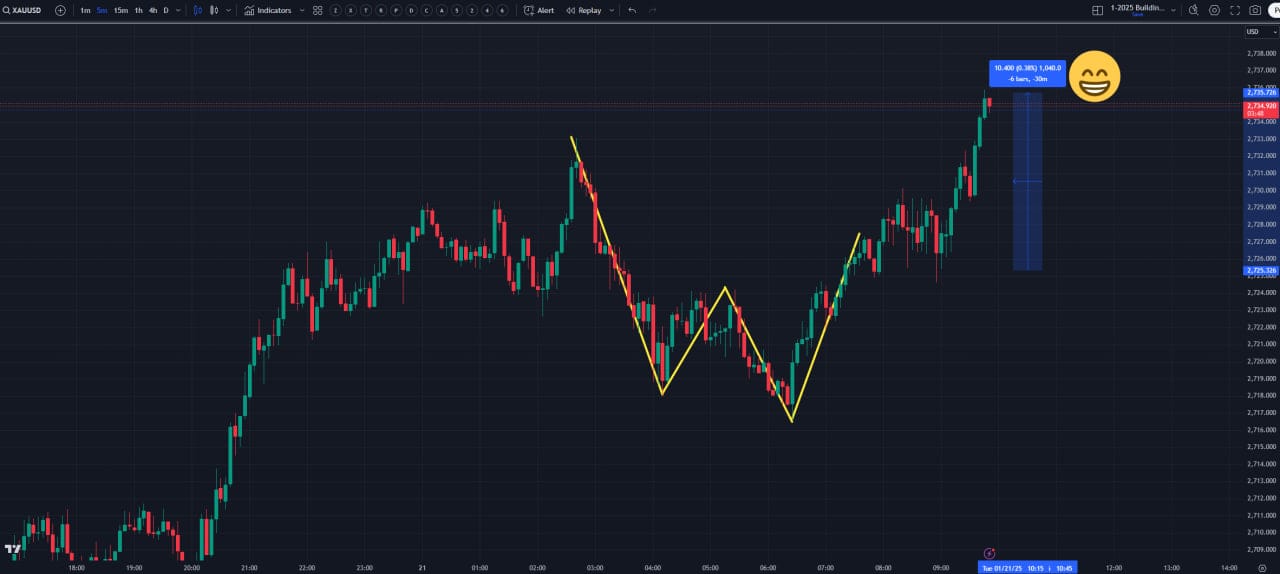
For example, a bullish breakout with a candlestick closing above its resistance level (as seen in the W pattern example) shows that buyers have overcome selling pressure, opening the door for further upward movement. Traders often measure the height of the preceding pattern to estimate the breakout’s target.
Practical Steps to Let Candlesticks Guide Your Trades
Observe Wick Patterns: Long upper wicks near resistance indicate selling pressure. Long lower wicks near support indicate buying pressure.
Combine with Volume: Volume confirms the validity of a candlestick’s story. For example, a breakout on high volume is more trustworthy than one on low volume.
Look for Confirmation: Always wait for the next candlestick to confirm a reversal or continuation pattern. For example, after a hammer, a bullish candle closing above the hammer’s body strengthens the reversal signal.
Use Support and Resistance Levels: Align candlestick patterns with these levels for greater accuracy in your predictions.
Why Candles Talk (and Why You Should Listen)
Candlesticks are more than just lines on a chart; they reflect the collective psychology of buyers and sellers. Wicks and sticks show where the battle between bulls and bears rages, who wins, and where the market might go next. By learning to read them, you unlock a new level of understanding that can enhance your trading decisions.
As demonstrated in this thread, candlestick patterns such as the doji, hammer, and W patterns give traders clear signals—but only if they take the time to listen. By combining candlestick analysis with other tools like volume and trendlines, you can create a more comprehensive trading strategy.
So, next time you look at a chart, pay attention to what the wicks and sticks are telling you. The market is always talking; it’s up to you to listen.

Reading the Market Trend
Lorem ipsum dolor sit amet, consectetur adipisicing elit. Autem dolore, alias, numquam enim ab voluptate id quam harum ducimus cupiditate similique quisquam et deserunt, recusandae.

About the Book
Steve Nison’s Japanese Candlestick Charting Techniques: A Contemporary Guide to the Ancient Investment Techniques of the Far East, Second Edition is a definitive resource on candlestick charting—a powerful and versatile tool for analyzing and predicting market trends. Blending ancient Japanese methods with contemporary market analysis, this book is a must-read for traders, investors, and financial analysts seeking deeper insights into market behavior.
The book introduces readers to candlestick charting, an ancient Japanese technique used to visualize price movements and predict market trends. Nison’s work not only explains how these charts operate but also highlights their relevance and effectiveness in modern financial markets. By merging Eastern wisdom with Western technical analysis, the book serves as both a practical guide and an advanced reference manual.
Order the Book: https://amzn.to/3Cf4LC4
©2025 Pro Series Profits & CSA5Steps. All Rights Reserved.